06.
Online Store Sales Dashboard
A Streamlit dashboard over an online store's order export: sales, seasonality, geography, payment, order status and customers, filtered by period and region.
- Role
- Developer & analyst
- Year
- 2026
- Focus
- Data Analysis
- Tools
- Python, Streamlit, Plotly, Pandas, NumPy
Overview
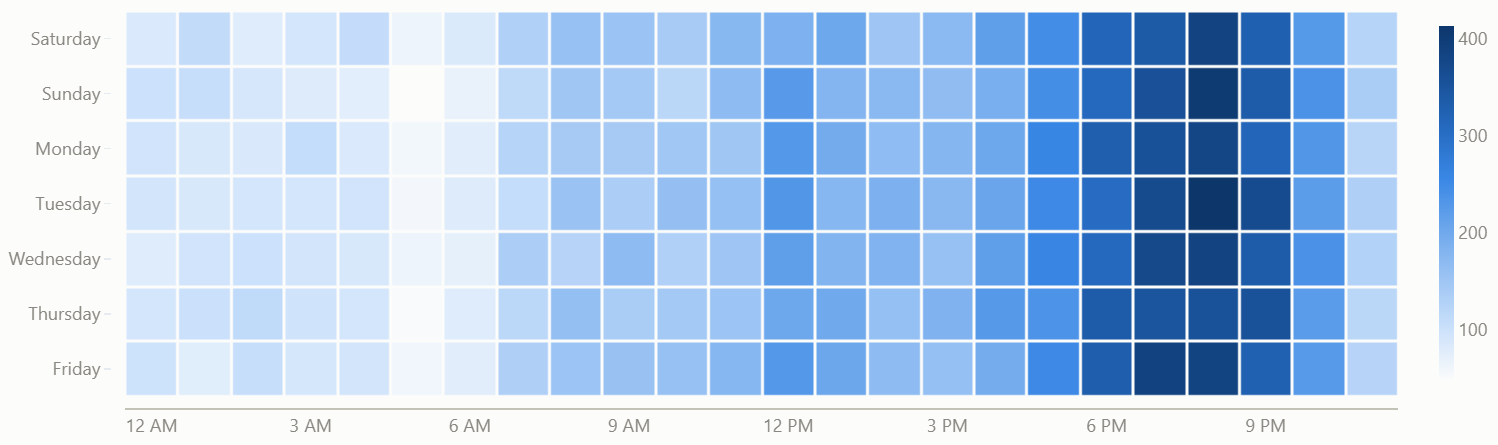
A dashboard for an online store's order export, 39 columns per order, built in Python with Streamlit and Plotly. Filters for period, order status, region, governorate, payment type and store language apply across eight tabs: overview, seasonality, geography, shipping, payment and status, customers, baskets and discounts, and notes.
Seasonality
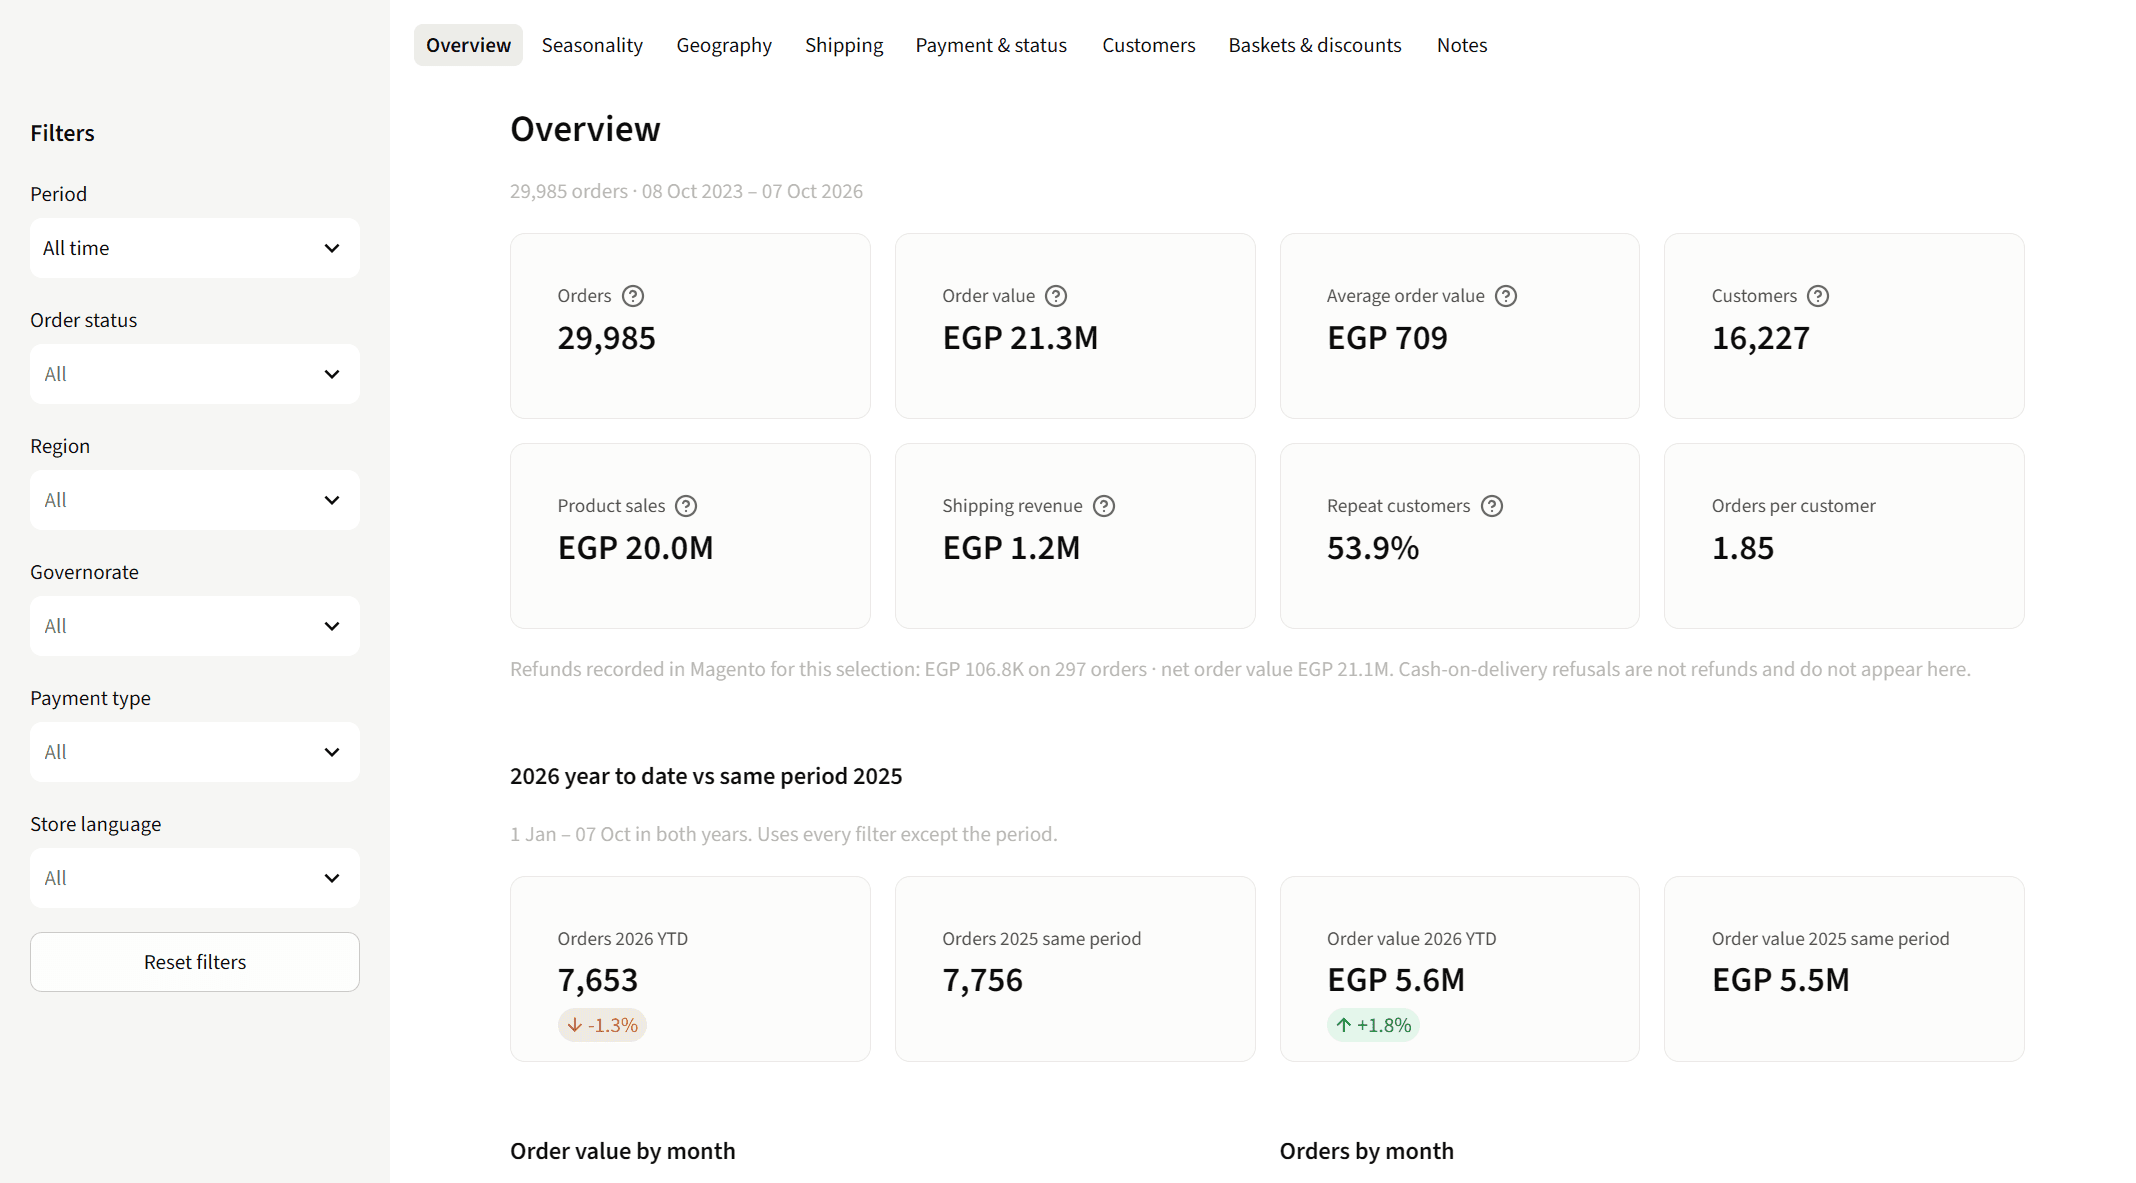
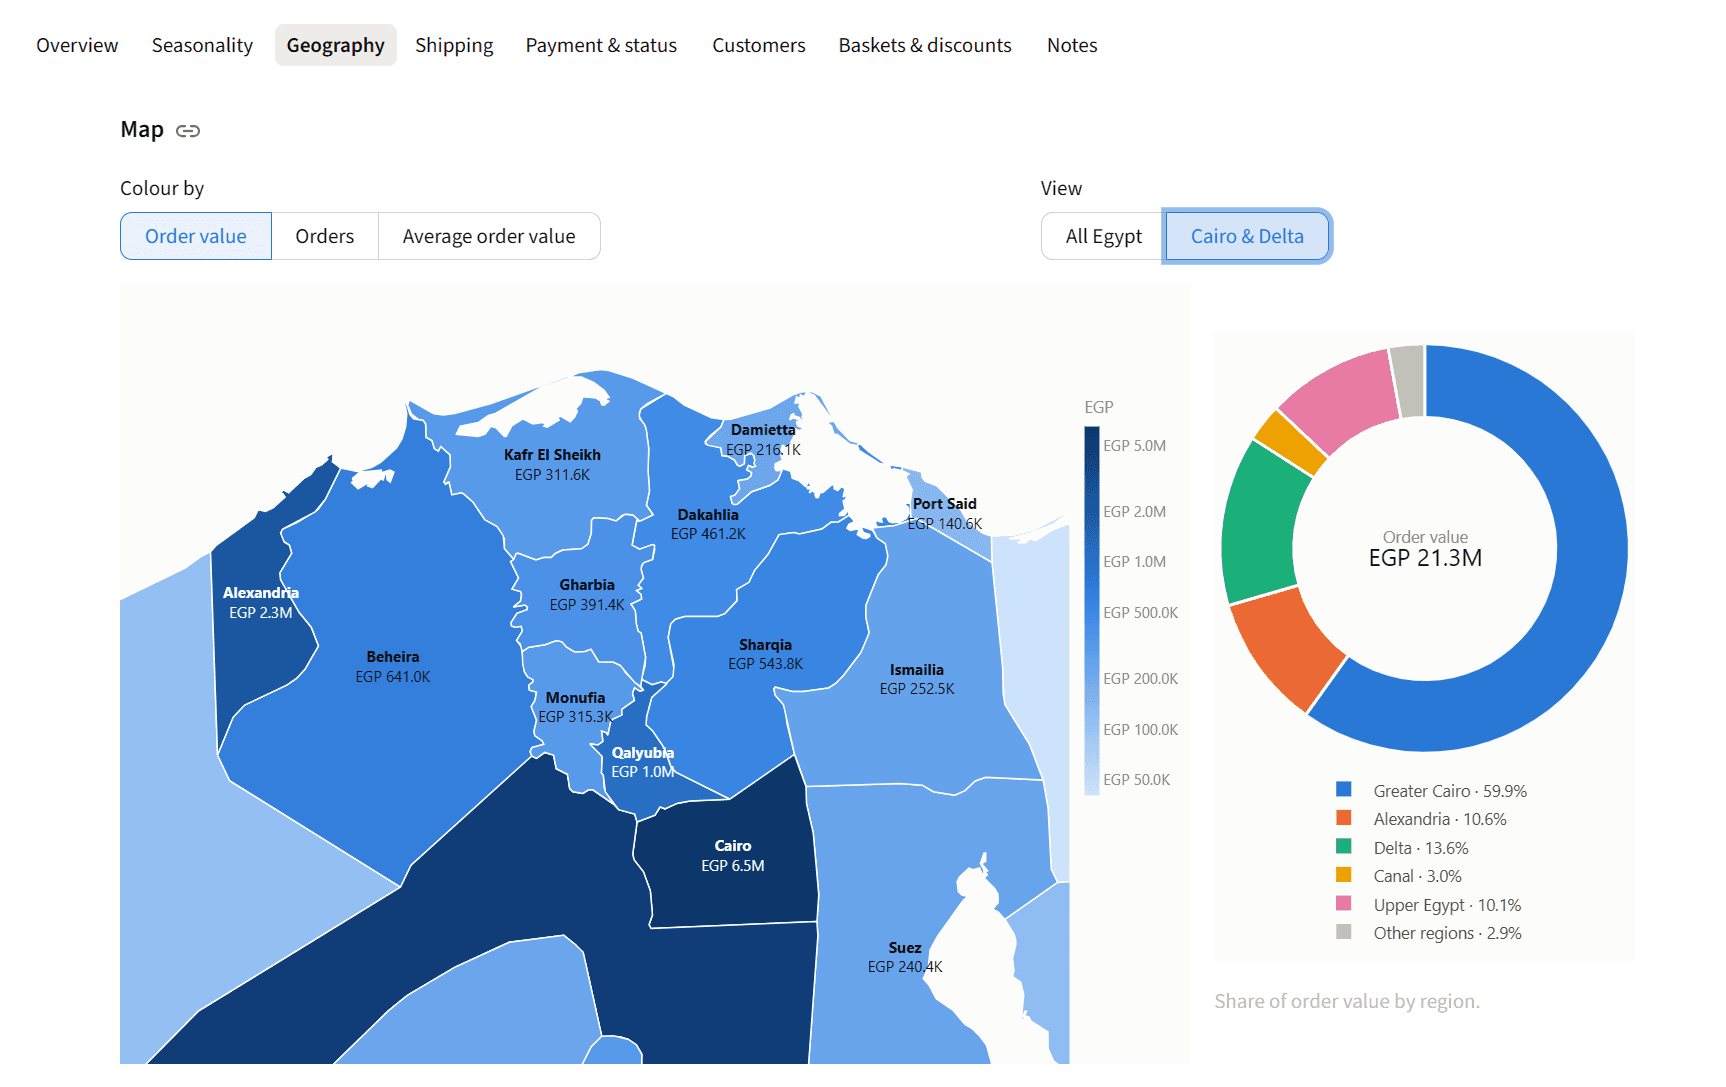
When orders are placed, as a heatmap of weekday against hour, with the busiest day and hour picked out.
Geography
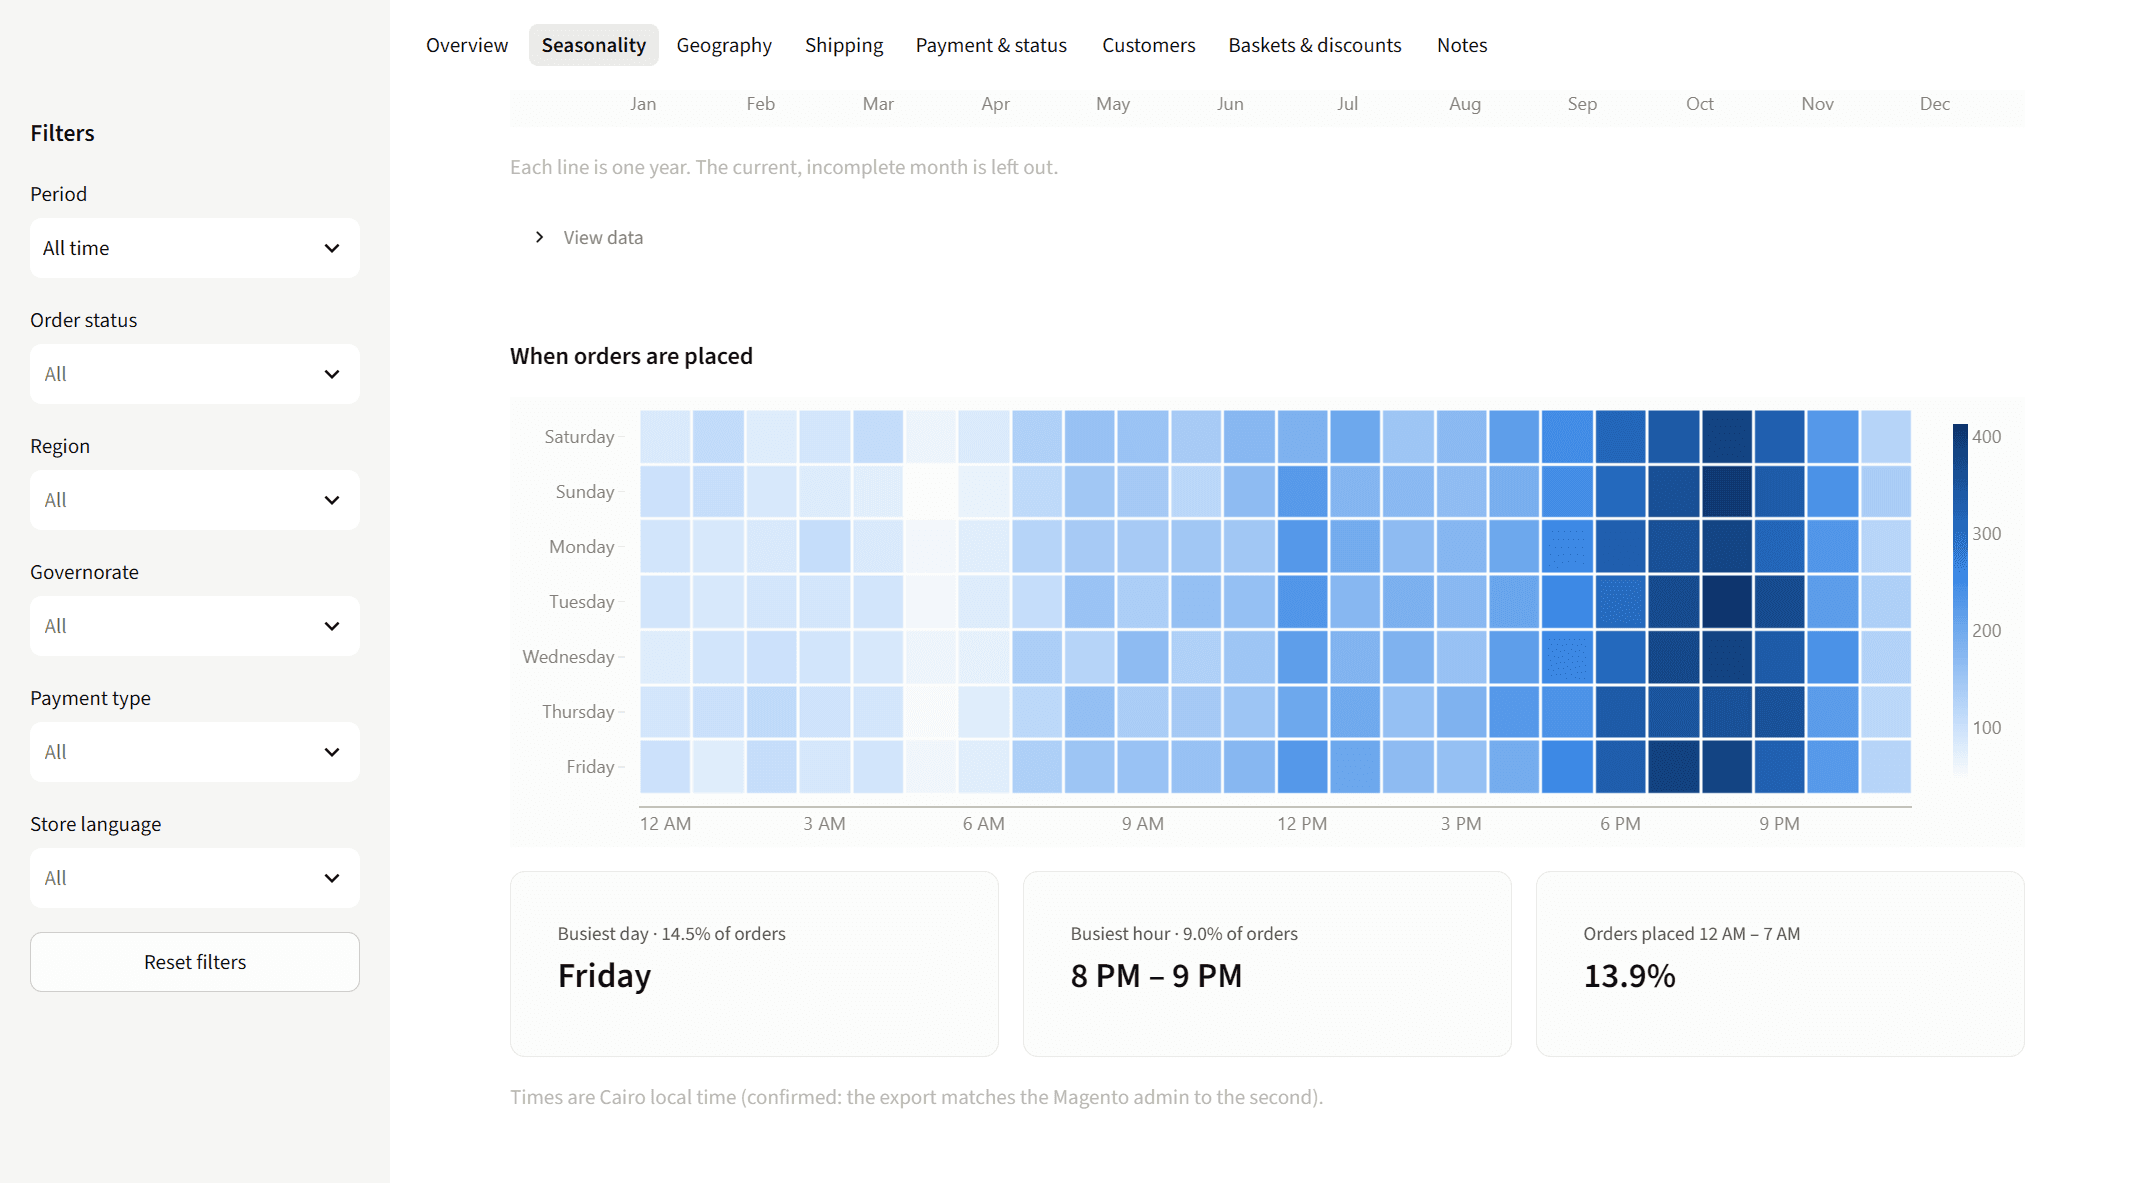
Order value by governorate on a map of Egypt, or zoomed to Cairo and the Delta, beside each region's share of order value.
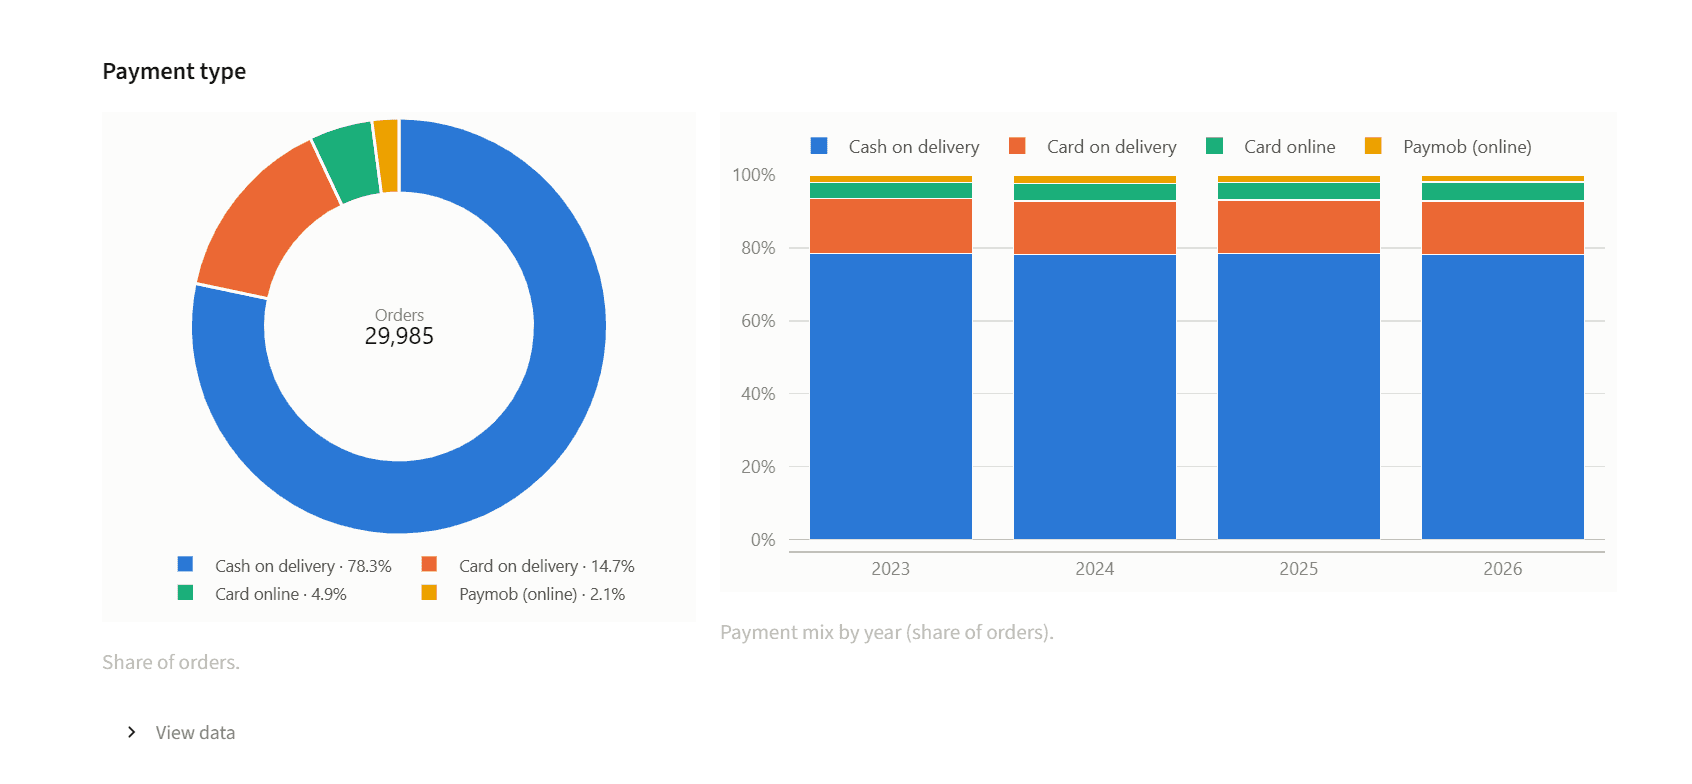
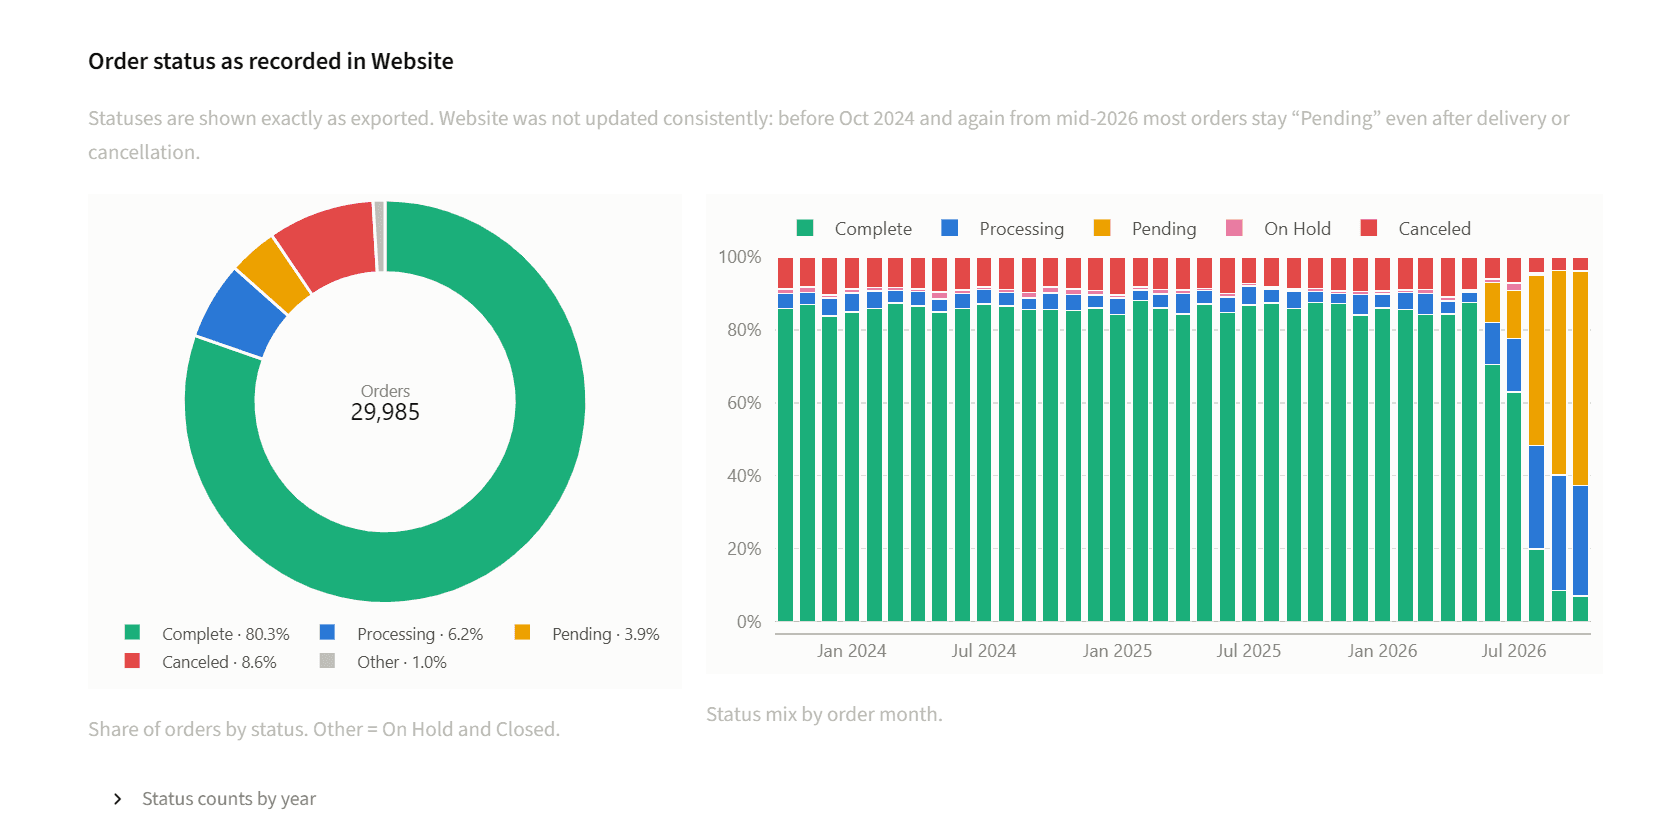
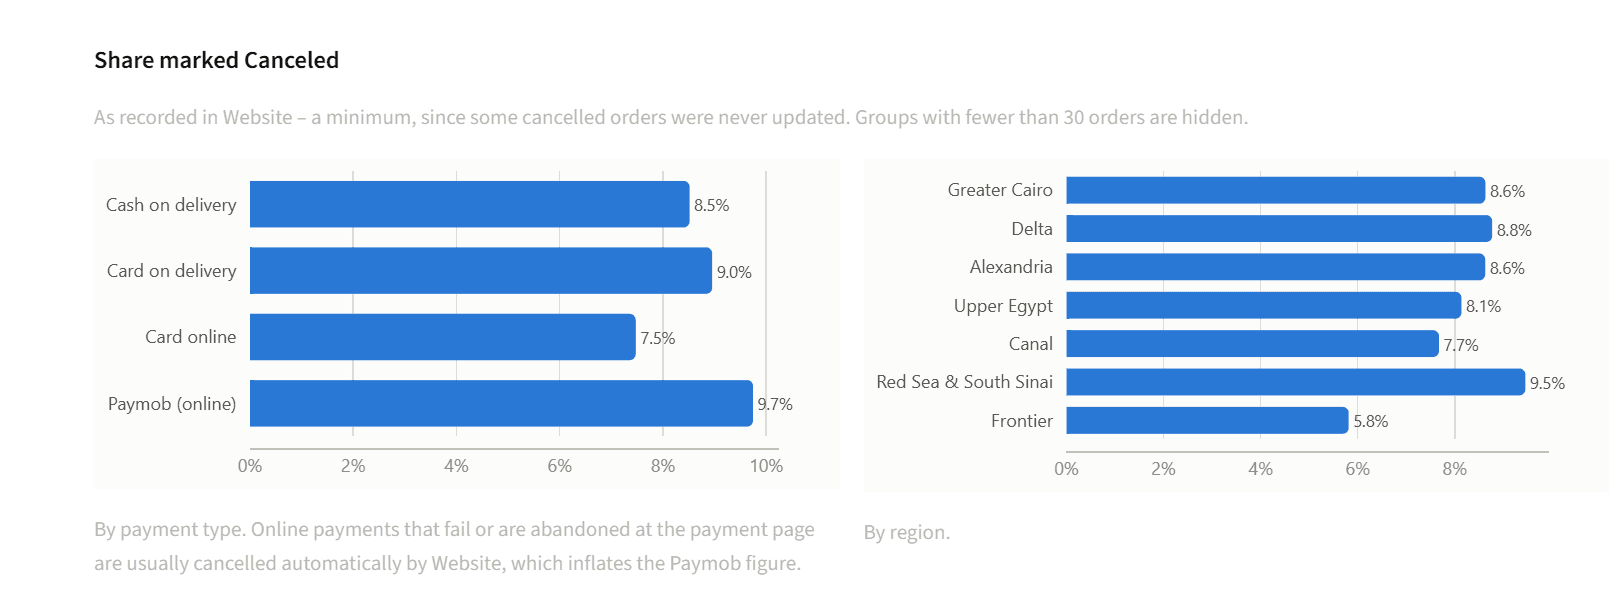
Payment and status
Customers
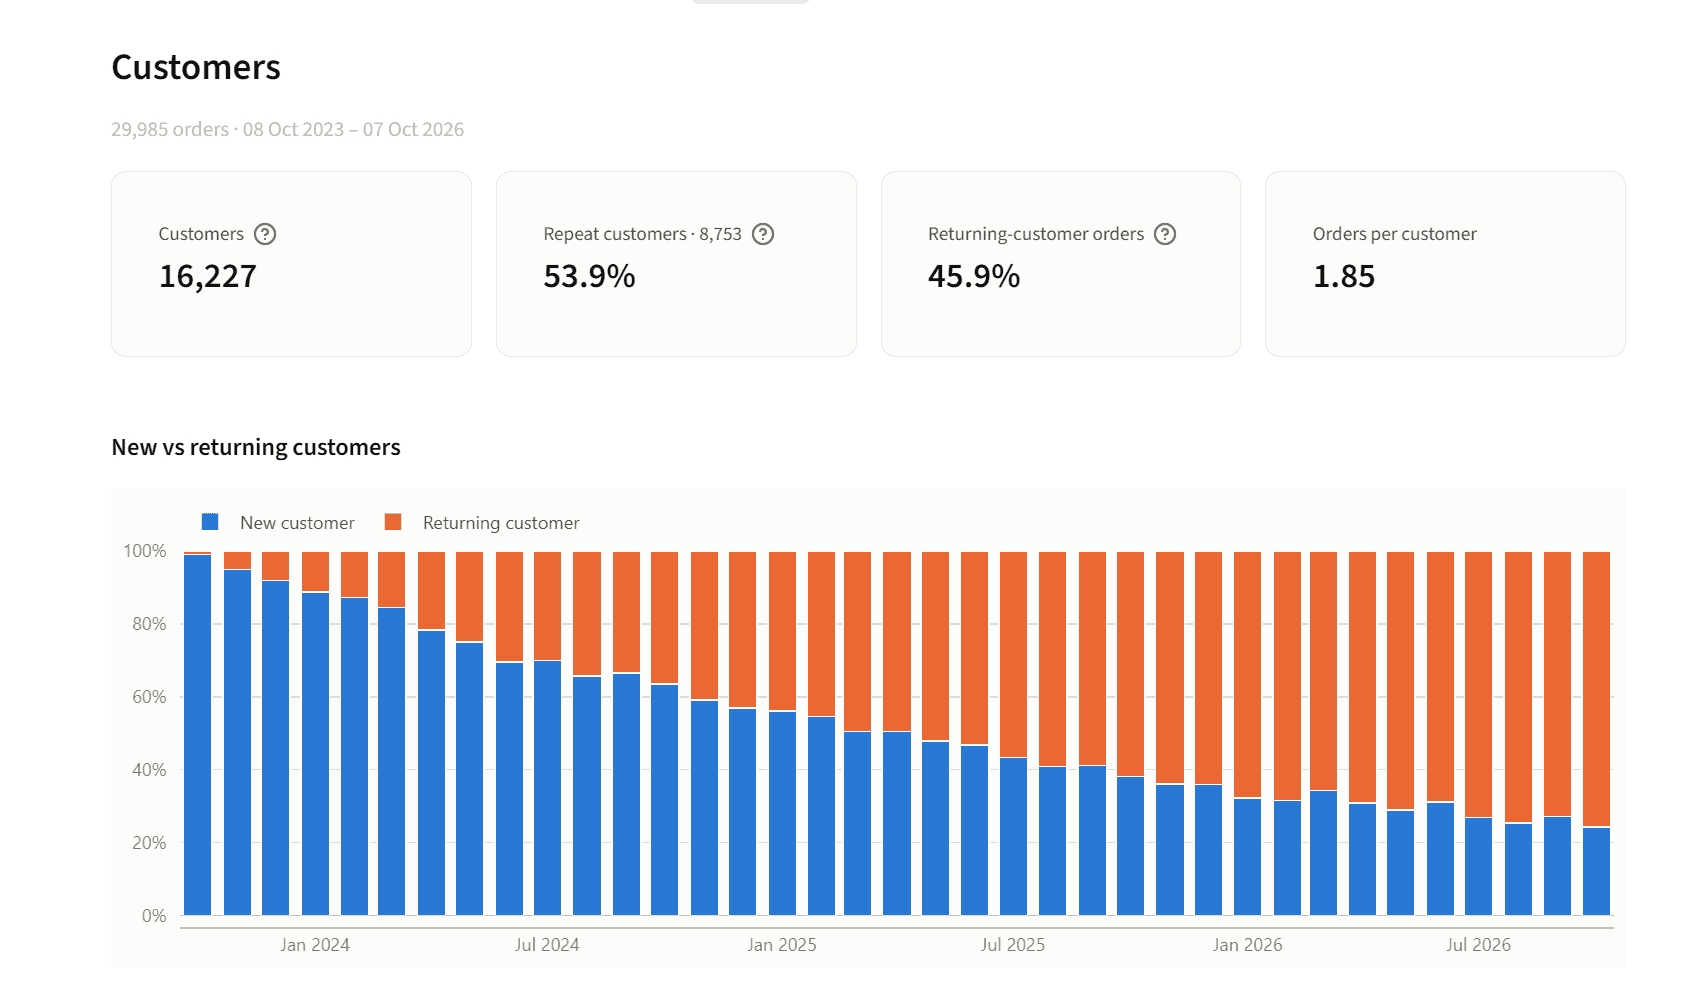
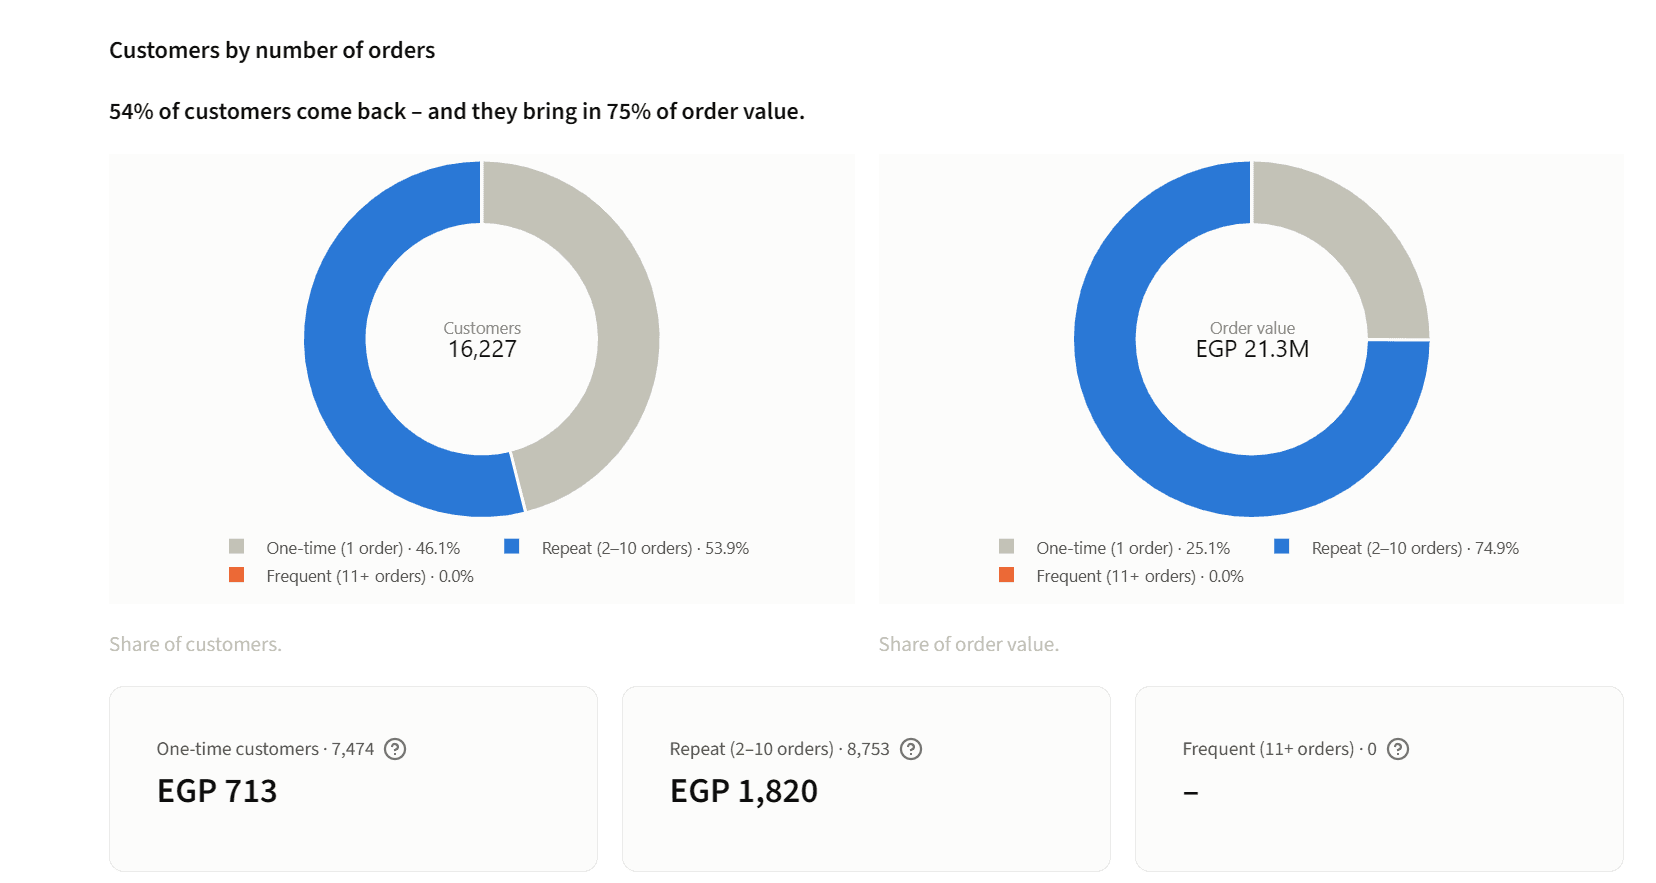
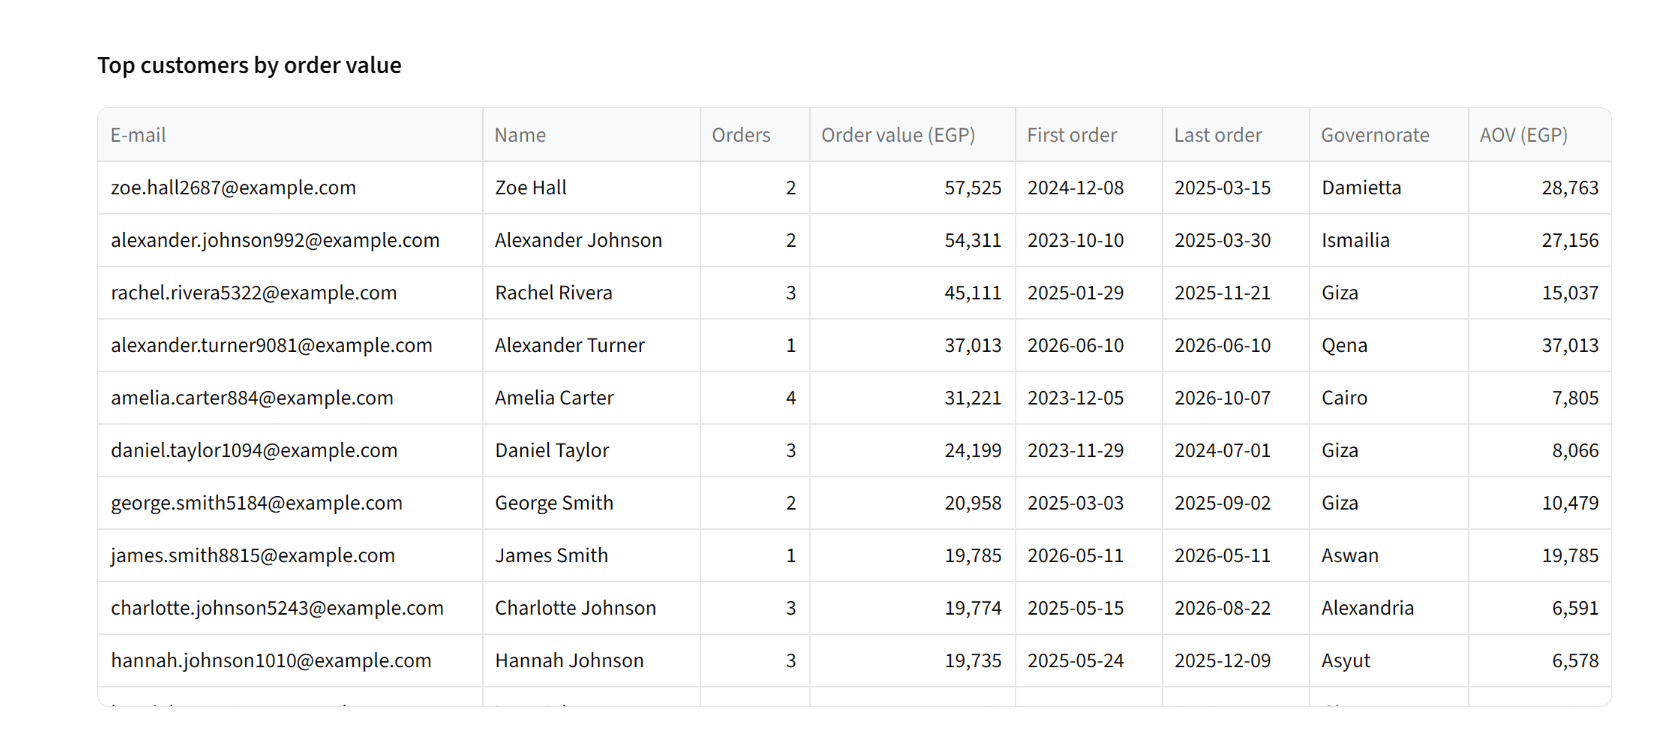
New against returning customers month by month, and how one-time and repeat customers split the orders and the order value.
Checked twice
A test script rebuilds every figure a second way from the spreadsheet cells and compares the two results.
About the data shown
These screenshots run on invented data: 30,000 made-up orders from October 2023 to October 2026, with the same 39 columns and the same Egyptian governorates as the real export. Every name, e-mail address and figure is fake; the calculations are the ones the production dashboard uses.